
Want to Know Which Services Your Clients Really Want? Here's How FigsFlow Analytics Can Help!
Stop guessing which services your clients want. Use FigsFlow Analytics to reveal your top sellers, boost conversions and focus on making money.
You've probably faced this dilemma: You know some services bring money but you're never quite sure which ones your clients really want.
Result? You end up chasing leads that don't convert and spending time promoting offerings that don't gain traction – wasting valuable time, money and effort.
But what if you had access to data showing exactly how your services are performing at all times? Imagine the possibilities! You could run targeted ad campaigns to further boost your most popular services, customise your proposals to match what your clients are truly asking for and prioritise the deals that are more likely to close.
FigsFlow makes this dream come true with its amazing analytics. It shows you exactly what you need: the deals you've won for each service, the revenue they bring in, the conversion rate and most importantly, who on your team is making it happen.
Today, let's see how you can make the most of FigsFlow's analytics to recognise your most in-demand services, and use those insights to grow your practice.
Why Knowing Your Most Sold Services Matters
Imagine trying to serve your clients without knowing what they want. You'd waste time, push irrelevant offers and miss opportunities. But, worst of all, you'd not even know that you're not doing the right thing.
That's why tracking demand matters. It shows where your attention is going, what clients are asking for and where your firm is gaining traction.
When you know what's in demand, you can create smarter proposals, bundle services more strategically and make sure your marketing and sales efforts are aligned.
For Example:
If you notice company formations are being frequently requested but rarely converted, and tax planning gets fewer leads but higher conversions and revenue, you might spend more on marketing tax planning, price it accordingly and assign your best people to those deals.
Understanding your most sold services lets you act on what's working rather than only relying on guesswork.
Where to Find Demand Trends in FigsFlow
The FigsFlow Analytics dashboard gives you a clear visual overview of how your deals are performing.
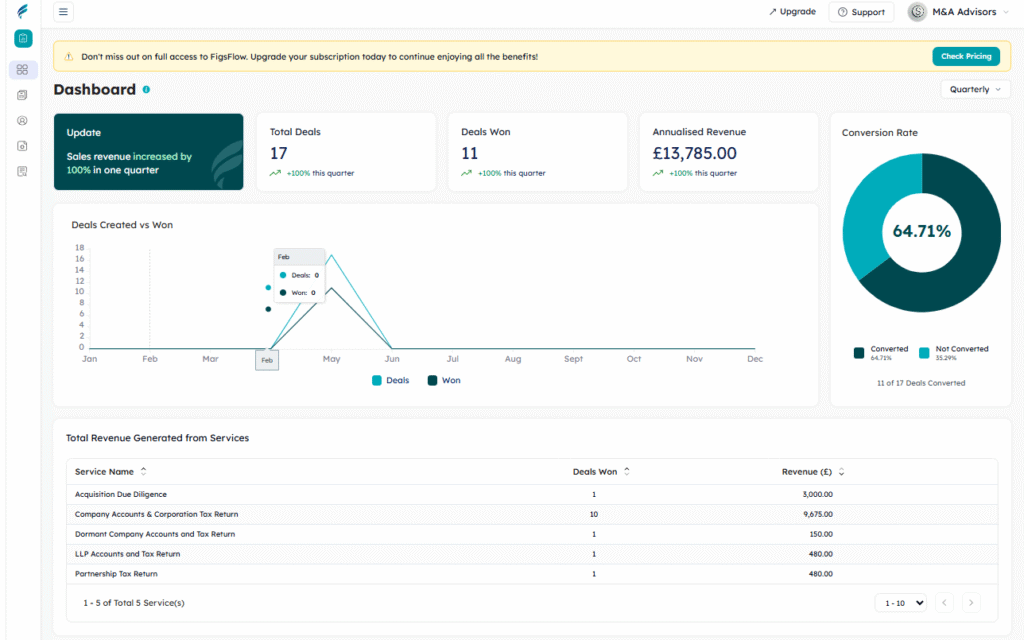
At the top, you will see total deals, deals won, annualised revenue and the overall conversion rate. This shows how well your proposals are performing and how successfully you are closing deals.
A line graph shows how many deals were created vs won each quarter. This helps you identify spikes in demand, performance dips and seasonal trends so you can prepare in advance.
Under that that, you will find a revenue breakdown categorised by service type. It shows:
- Number of deals won per service
- Revenue generated from each
All this information combined lets you see exactly which services are in demand, which are bringing in the most money and how well your team is performing.
For Example:
- Company Accountants and Corporation Tax Return is in demand and generating £9,675 in revenue.
- Acquisition Due Diligence, though only one deal, brought in £3,000
- Other services like Dormant Company Accounts, LLP Accounts and Partnership Tax Returns saw minimal traction
How to Respond to What the Market Wants
Based on the example FigsFlow analytics above, you can reach the following conclusions about your services:
- Company Accountants and Corporation Tax Return best resonate with your target audience
- Acquisition Due Diligence is worth position as a premium service for high-end clients
- Other services either need to be repositioned or repackaged as they saw minimal traction
Here's how you can respond to these findings:
- Double Down on Best Sellers
- Lead outbound sales efforts with your best sellers (Company Accountants and Corporation Tax Return)
- Run targeted campaigns focused on your top-performing services, highlight case studies, testimonials and outcomes.
- Bundle Wisely
- Use high-performing services to draw attention to lesser-known offerings. For example, bundle LLP Accounts with Company Accounts.
- Offer discounts when clients purchase bundled packages. This lets you increase the average deal size and gives lower-performing services more visibility.
- Revise Pricing & Packaging
- Introduce tiered pricing for high-demand services. This allows you to capture different client segments.
- Offer fixed fee "starter packs" for common service combinations. This simplifies purchasing decisions and reduces friction.
- Educate the Market
- Low-performing services often suffer from a lack of awareness. So, create educational content (videos, blogs and webinars) explaining why these services matter, who they're for and what risks they help avoid.
Additionally, you can phase out underperformers, segment your market, personalise outreach and identify upselling opportunities.
No matter what, data backed decisions will always outperform guesswork.
And FigsFlow's analytics ensure you offer what the market wants.
When to Review Analytics & Adjust Strategy
Checking your analytics at the right time ensures your strategy remains aligned with what's working.
Here are the best occasions when you should dig into FigsFlow's analytics:
- At the End of Each Quarter – You can review analytics and evaluate your leads, conversion rates and revenue from each service. This way, you can spot market trends early and shape your focus for the next quarter.
- After Campaigns or Promotional Pushes – Check your FigsFlow analytics as soon as your seasonal or lead generation campaigns are over. It lets you identify patterns and double down on what's working.
- During Team Reviews – FigsFlow analytics highlight what services are generating the most revenue and which team member is closing the most deals. You can use this information during team reviews and appraisals.
Reviewing FigsFlow analytics at these key points keeps you proactive and helps you make every proposal count.
What to Do Next with These Insights
Once you have reviewed your FigsFlow data and identified what's working, it's time to take action.
- Refresh Your Proposals – Update your proposal templates to reflect what's resonating with clients. This helps you align with market demand and improve your win rates.
- Fine-Tune Your Workflow – If analytics show that a certain team member is doing great at closing certain types of deals, reorganise your internal handovers and lead distribution. Match the right person with the right job.
- Revisit Pricing Conversations – Just because your services are selling well doesn't mean they are priced right. You can use FigsFlow's advanced service pricing calculator to calculate prices and charge what you're truly worth with confidence.
Let FigsFlow analytics guide smarter decisions across proposals, pricing and team strategy.
Conclusion
FigsFlow's analytics gives you a clear view of how your services are performing. You can see:
- Total deals created, won and lost
- Conversion rates over time (monthly, quarterly and annually)
- Revenue breakdown by service type
- And most importantly, who created each deal and its status.
You can use these insights from to update proposals, fine-tune your workflow and revisit pricing conversations. If you're already using FigsFlow, make it a habit to review your analytics regularly and act on what you learn.
If you're not using it yet, start your 30-day free trial and see how FigsFlow helps you turn insight into action.
Run your firm on one platform
Proposals, engagement letters, pricing and AML — built for ACCA, ICAEW, ATT, CIOT, AAT and CIMA firms.